Prosperity for All
Align with Our Shared Vision of
Regional Prosperity
Kansas City is a community of communities. Millions of lives woven together, across borders and neighborhoods, sharing one future.
Every aspect of our region contributes its own history, perspective, and energy. The challenges posed by the area’s diverse nature are surpassed by what it brings in unmatched potential.
KC Rising is how KC’s leaders forge new approaches toward greater collaboration to guide us forward.
Which Pillar Would You Like to Explore?


Metrics
Framework

Horizon Goals
Growing the Economy, Including Everyone
Compared to benchmark metros
Pillar Metrics
Progress toward the 7 shared vision pillars of prosperity
Strategy Metrics
Related to community efforts that we are trying to amplify
Monitoring and celebrating success over time
Horizon Goal Trendline Metrics
Benchmark metros:
Austin, Charlotte, Cincinnati, Columbus, Denver, Indianapolis, Minneapolis, Nashville, Portland, and Raleigh
GROWING THE ECONOMY
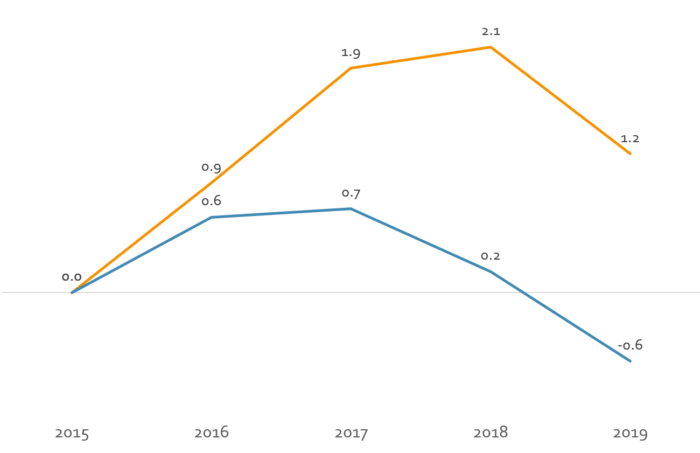
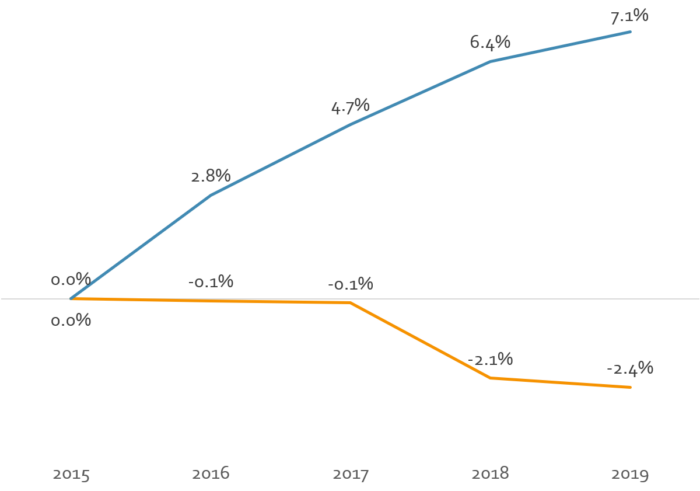
Net Migration
Measuring change in Net Migration per 1000 Population over time (2015-2019) using the most recent available data. Several of the higher-performing benchmark metros (Denver, Portland, and Austin) have seen their net migration rates drop. KC continues to improve, though 2019 was a slower rate than in 2018. Note: the orange color represents the Kansas City region, the blue line represents the benchmark metro average.
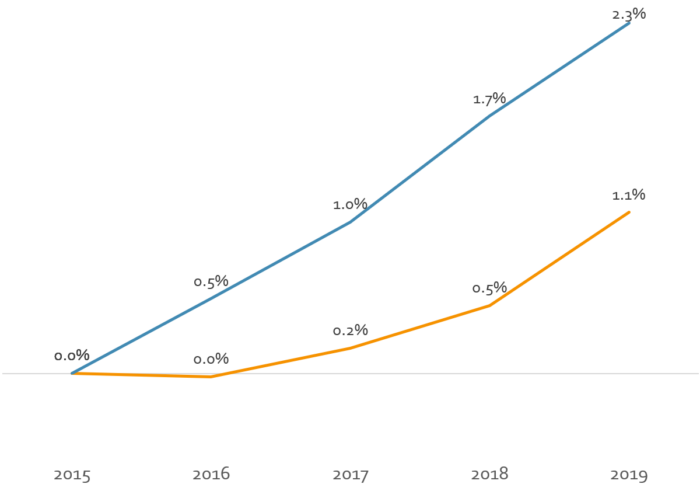
GDP Per Job
Measuring percent change in GDP Per Job over time (2015-2019) in comparison to our benchmark metros. Our rank is currently 9th, but we are accelerating in comparison to metros like Indianapolis, Nashville and Charlotte – so the gap is no longer widening. Note: the orange color represents the Kansas City region, the blue line represents the benchmark metro average.
& INCLUDING EVERYONE
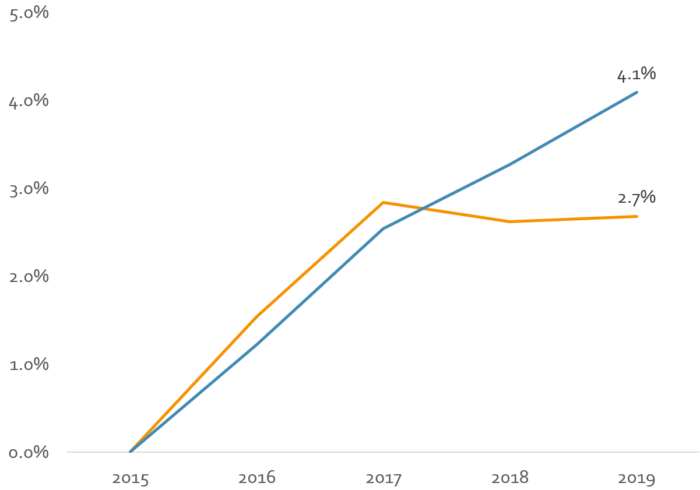
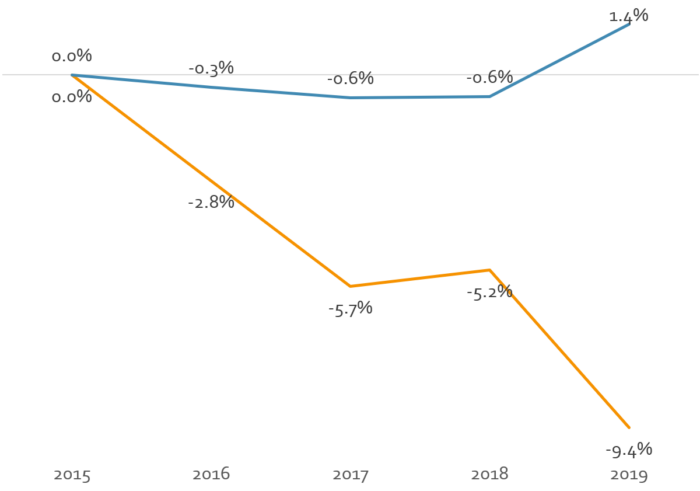
Percent of Workers in Self-Sufficient Households
Measuring change since 2015 through 2019. Our rate of improvement in self-sufficient workers stopped in 2017. We are currently ranked 6th in comparison to benchmark metros, but our improvement ranks KC last, causing us to fall behind some metros we used to be ahead of – Austin and Indianapolis. Note: the orange color represents the Kansas City region, the blue line represents the benchmark metro average.
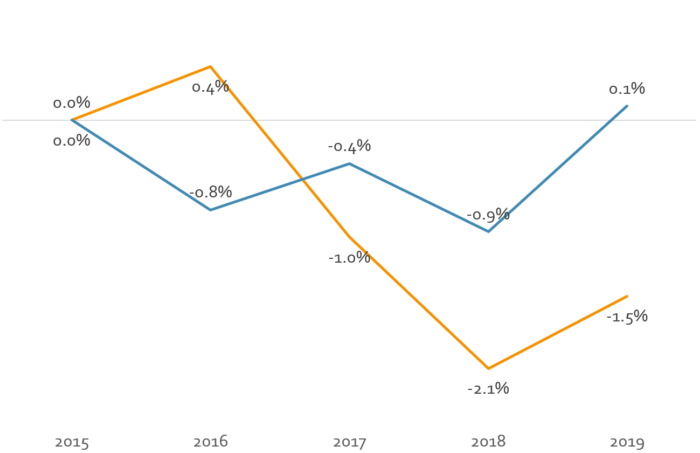
Average Housing Wealth
This measure simultaneously accounts for disparities in homeownership rates and home values between Black, Latino, Asian and White households. KC starts off low, but the wealth gap has increased since 2015 for Black, Latino and Asian households. Note: the orange color represents the Kansas City region, the blue line represents the benchmark metro average.
Average Housing Wealth
Annual change in the Latinx percent of White housing wealth. Note: the orange line represents the Kansas City region, the blue line represents the benchmark metro average.
Average Housing Wealth
Annual change in the Asian percent of White housing wealth. Note: the orange color represents the Kansas City region, the blue line represents the benchmark metro average.
Note: the above calculations are based on three year moving average data series
Questions for KC Rising
Do you have any questions relating to KC Rising? Are you interested in learning more about a specific pillar?
Please contact us for more information on how to get involved.
Align with the Pillars
Sign up for periodic updates and news.