What We Do

Amplifying Community Efforts
KC Rising formed in 2015 to help KC grow faster and more intentionally. It is business-led, metrics-based and long-term focused. KC’s businesses are positioned to lead this charge by nurturing partnerships and cultivating innovation.
We amplify community efforts by aligning corporations, foundations, nonprofits, governments, educational institutions, human services groups, civic leaders, and other members of the public square, accelerating a future of inclusive regional prosperity.

Our Purpose
To achieve a shared vision of regional prosperity for all by aligning and accelerating community efforts for the greatest impact.
When We Come Together
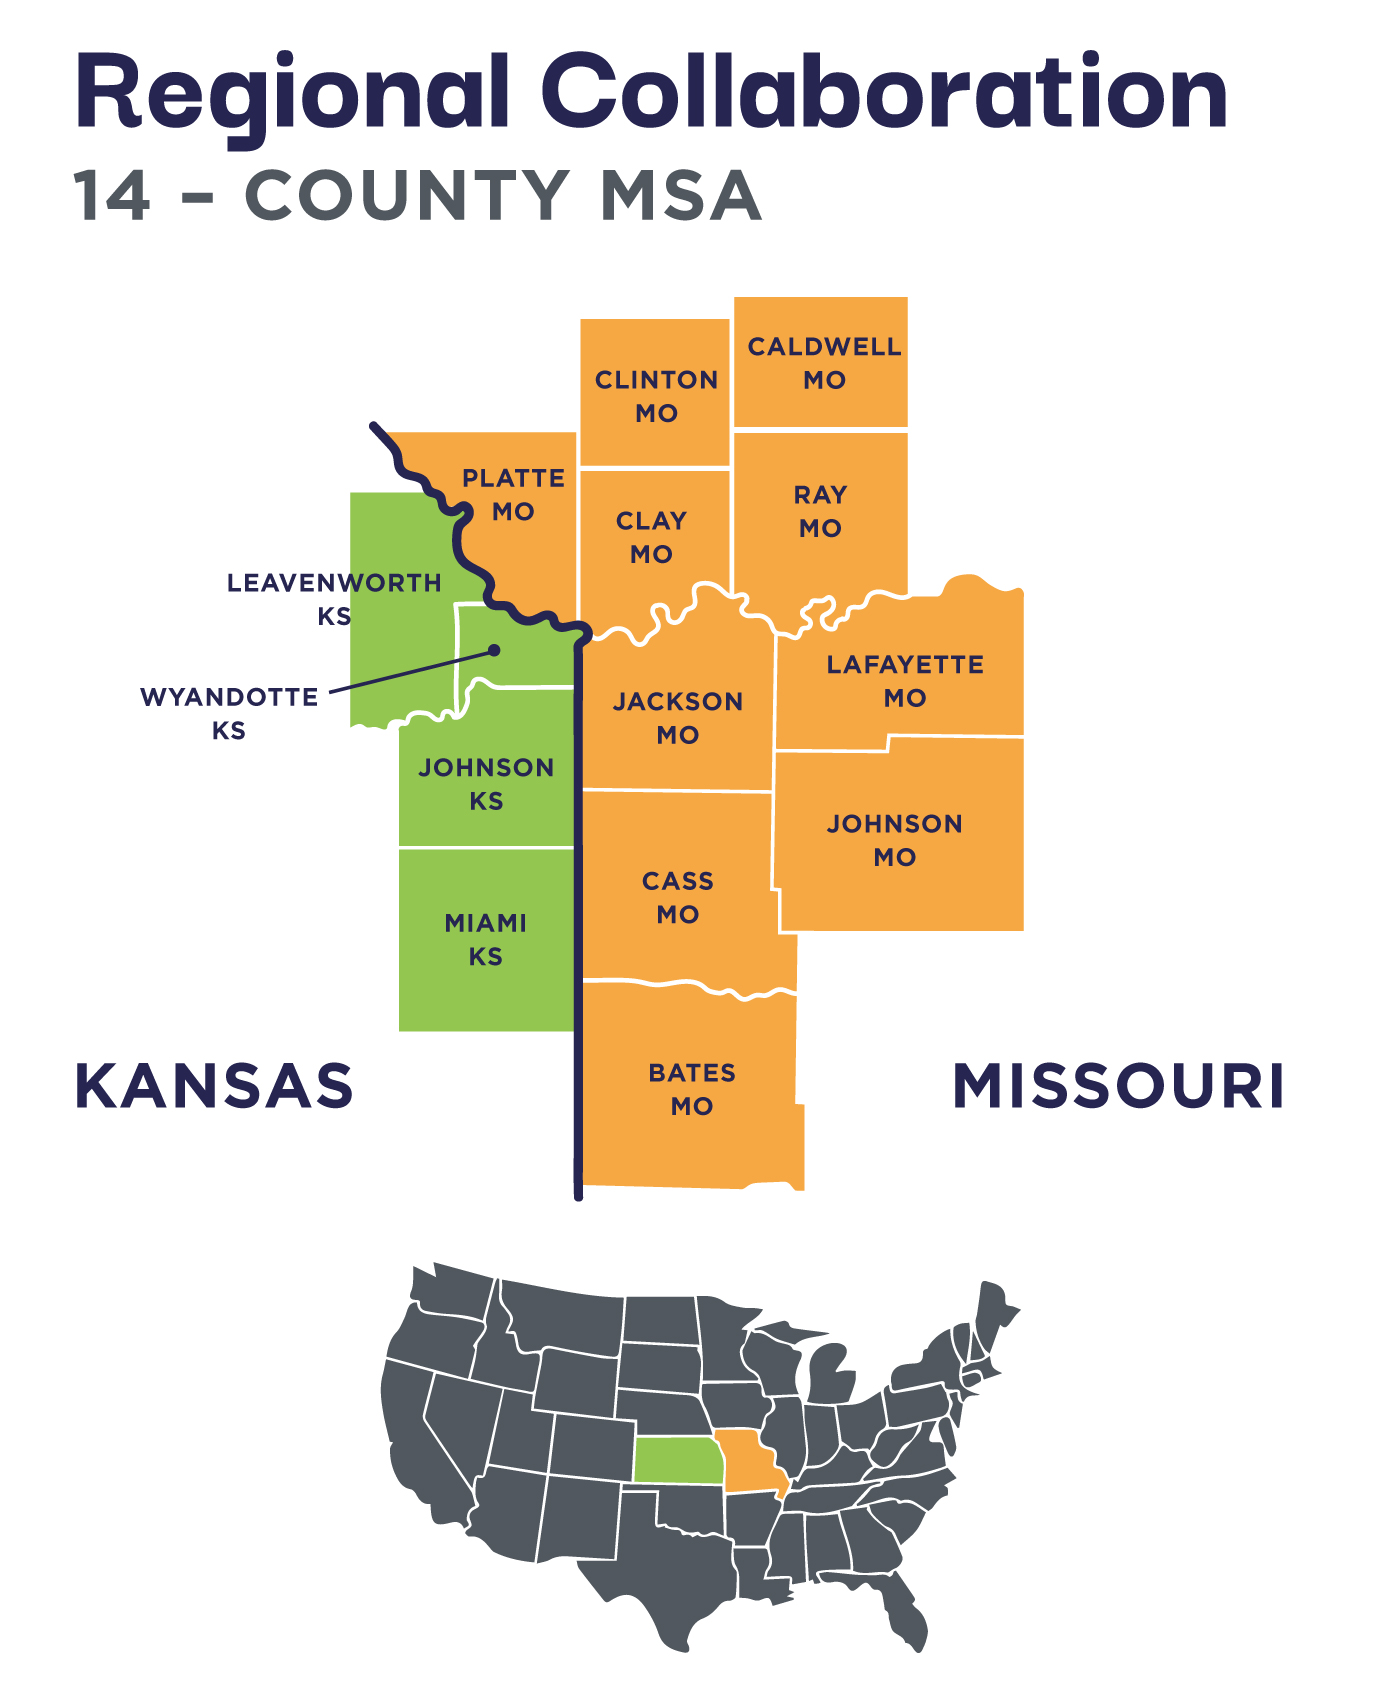
14 Counties
How does a 14-county metropolitan area, separated by state line, with proud histories in every town that both set a foundation and cast shadows, come together to get something done to address our challenges and capitalize on our opportunities?
We bring together the Stewards of the Public Square = Business, Education, Government, Human Service.
When we come together, it is amazing.


Distinct, but not Disconnected
What does KC Rising do?
Advocate
for outcomes, publicly and privately
Act
when necessary, when gaps exist
Amplify
community efforts for the greatest impact
Accelerate
a future of inclusive regional prosperity
Align
regional assets and initiatives to those priorities
What do participants get?
Connection
to others working to the same ends
Consensus
on aligning regional assets and initiatives
Celebration
of accomplishments
Building KC Rising with
Venue
We are a venue where ideas can come to plan and develop our future
Voice
We are a voice to amplify all other initiatives that meet our core goals

Our Shared Vision of
Regional Prosperity
Amplify & Accelerate
efforts for greatest impact
Metrics
Framework

Horizon Goals
Growing the Economy, Including Everyone
Compared to benchmark metros


Pillar Metrics
Progress toward the 7 shared vision pillars of prosperity
Comparing our progress over time

Strategy Metrics
Related to community efforts that we are trying to amplify
Monitoring and celebrating success over time
Trendline Metrics
Our Benchmark Metros
Austin, Raleigh, Charlotte, Nashville, Denver, Indianapolis, Columbus, Portland, Minneapolis, Cincinnati
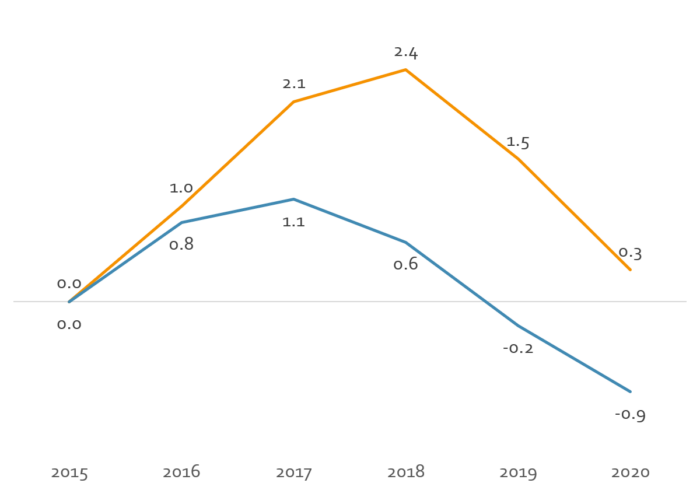
CHANGE IN NET MIGRATION PER 1K
POPULATION, 2012-2019
Overall, from a percent change perspective, Kansas
City is at the benchmark metro average. Note: the orange line represents the KC region. Blue represents benchmark metro average.
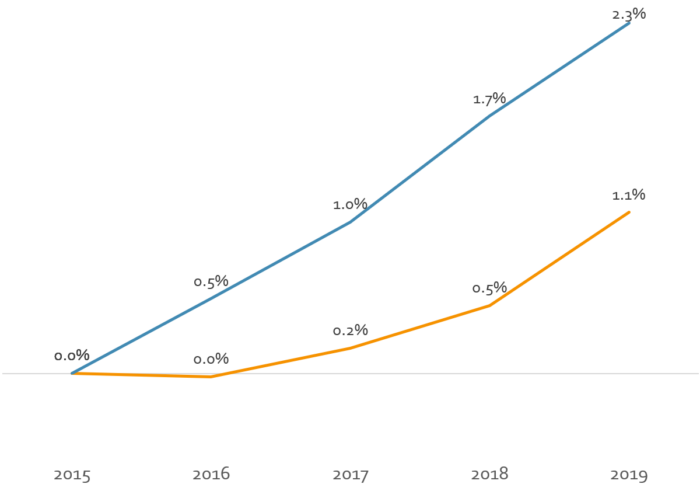
GDP PER JOB: PERCENT CHANGE, 2012-2018
The percent change in productivity for benchmark
metros has recently surpassed Kansas City. Note: the orange line represents the KC region. Blue represents benchmark metro average.
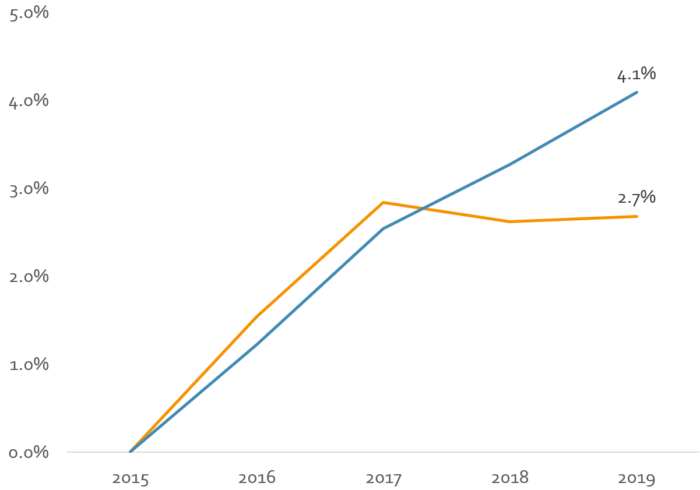
WORKERS IN SELF-SUFFICIENT HOUSEHOLDS,
2012-2018
The percent change of workers in self-sufficient
households is accelerating faster in benchmark metros
than in Kansas City. Note: the orange line represents the KC region. Blue represents benchmark metro average.
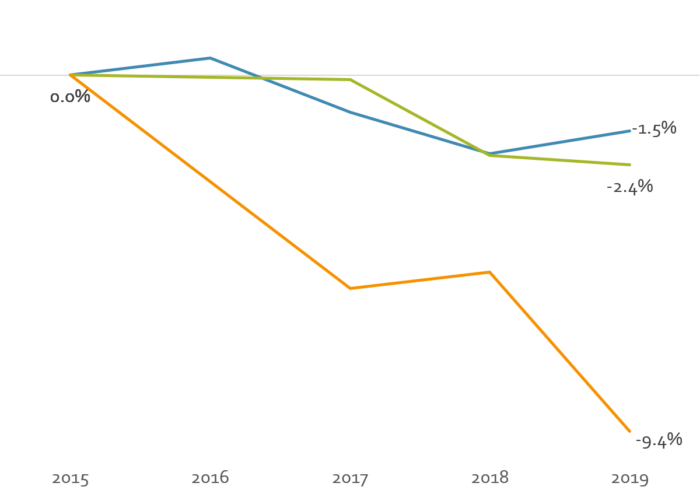
HOUSING WEALTH GAP,
2012-2018
While the average housing wealth gap generally
worsened in all benchmark metros, the change has
been steeper in Kansas City. Note: the orange line represents the Asian/White wealth gap, the green represents Latinx/White wealth gap, and the blue line Black/White wealth gap.
Facts & Figures
We desire top-level metrics that are more responsive, that suggest actions to take, that incorporate place and inclusion more directly.
In short, our goal is to grow the economy for everyone.
Questions for KC Rising
Do you have any questions KC Rising related? Please contact us for more information.
Want to get involved?
Join our newsletter
